Turn recorded smart-home power into an annual scenario
Calculate annual smart-home electricity scenarios from watts, hours, days and an explicit Australian-dollar tariff.
Updated:
Build a usage scenario rather than claiming savings
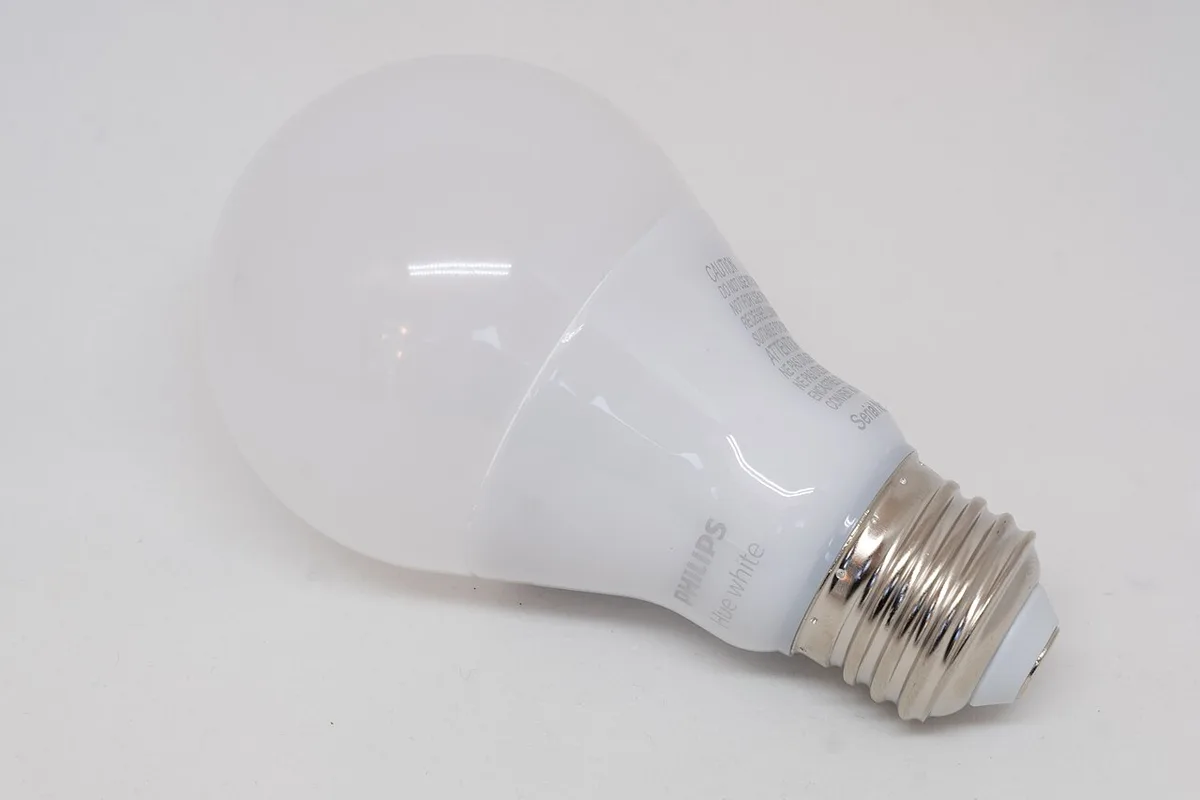
Annual electricity cost needs a stated power level, hours at that level, number of days and tariff. A device's maximum rating alone cannot supply those inputs. Australian Government smart-home guidance notes that automation equipment itself uses energy, including standby consumption. Keep that extra demand in the record instead of assuming that connectivity necessarily saves electricity. The documented Hue White A60 E27 1100 example lists 9.5 W operating power and 0.1 W standby. Those manufacturer figures can support a labelled scenario, but they are not measurements of your installed bulb or daily behaviour.
Australian Government smart-home energy guidance ? Hue AU White A60 E27 1100 model 8720169395268 ?
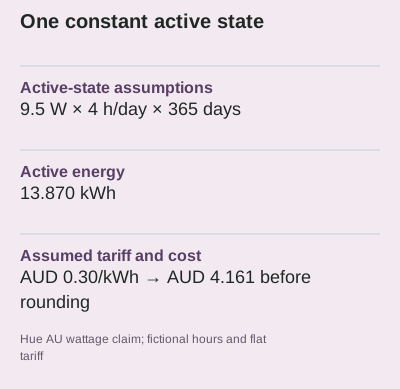
Calculate the active state with explicit assumptions
Assume one example bulb operates at the stated 9.5 W for 4 hours per day over 365 days. The arithmetic is 9.5 × 4 × 365 ÷ 1000 = 13.870 kWh. Use an explicitly hypothetical flat tariff of AUD 0.30 per kWh, giving 13.870 × 0.30 = AUD 4.161 in usage charges. Rounded to cents, that active-state estimate is AUD 4.16. This is not a live tariff, measured bill or promise about a dimmed lamp. If the actual power changes with brightness, the constant-state assumption needs replacing with an appropriate documented or measured record.
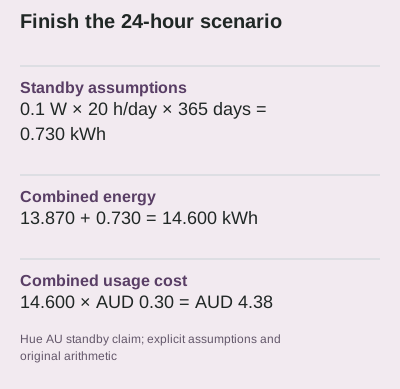
Add standby without double-counting the day
For the same fictional day, the remaining 20 hours are assigned to the documented 0.1 W standby state. That gives 0.1 × 20 × 365 ÷ 1000 = 0.730 kWh. At the same assumed tariff, standby costs AUD 0.219. Combining the unrounded figures gives 14.600 kWh and AUD 4.380, or AUD 4.38 when rounded to cents. The active and standby hours sum to 24; assigning 24 hours to standby and then adding 4 active hours would count 28 hours in a day. Keep state boundaries visible before extending the example to more devices.
Record supporting equipment as additional rows
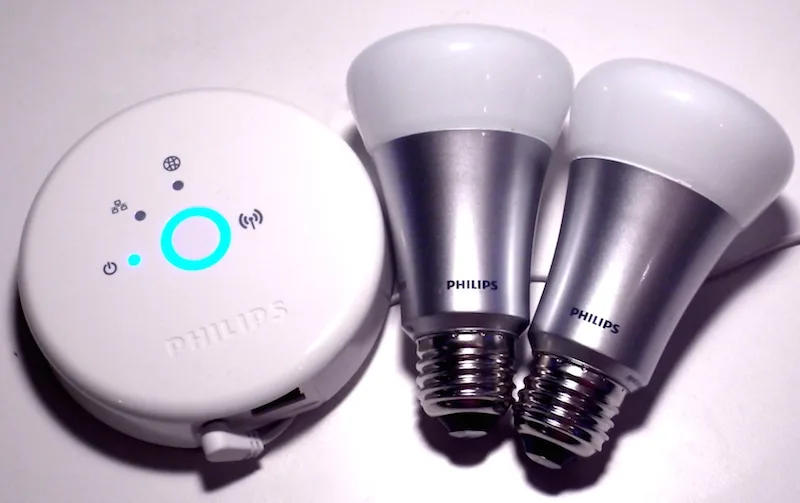
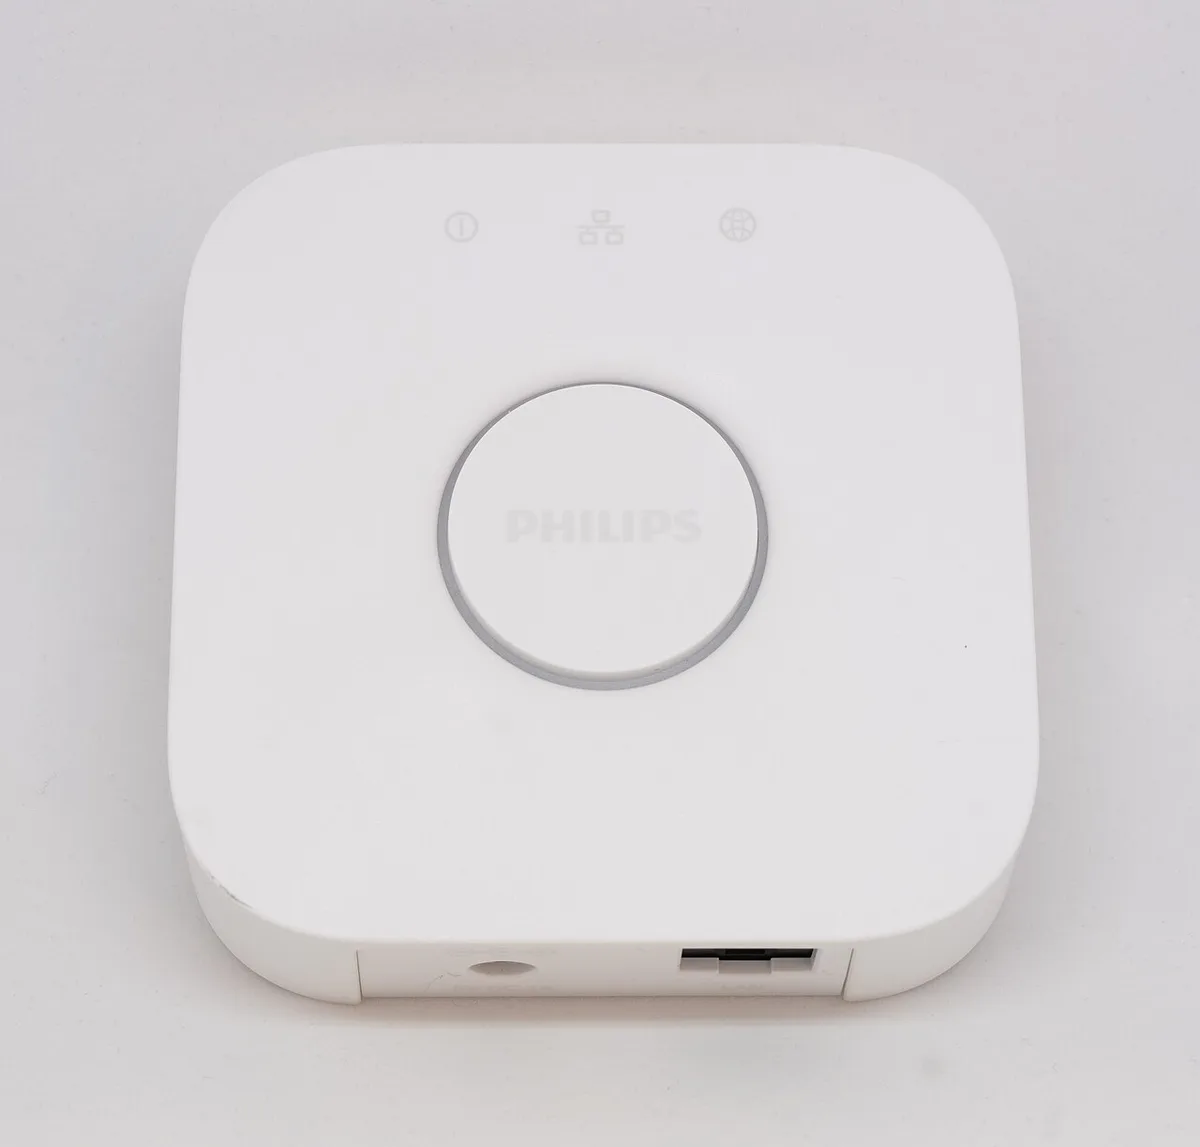
A bridge or controller can have its own consumption, and the bulb calculation does not include it. The real Bridge and kit photographs make those separate physical components visible; their photographs do not provide power measurements. Add each supporting device only when its appropriate documented or measured power and operating schedule are available. Do not invent a hub wattage to make the total appear complete. Likewise, exclude fixed supply charges from this usage-only calculation unless a separate comparison specifically needs them. A tariff with time-varying rates requires matching each usage period to the relevant price rather than applying this flat-rate shortcut.
Use the calculator with one state at a time
The tools page calculates a single constant power state. Enter 9.5 W, 4 hours, 365 days and AUD 0.30, then run the standby state separately with 0.1 W and 20 hours. Sum the unrounded state results for the combined scenario and round money at the end. Save the assumptions alongside the answer so a later tariff or schedule change can be recalculated. Comparing this scenario with a previous bill would require a defined baseline and comparable conditions. Without those, the useful conclusion is the scenario's own usage cost, not an unsupported claim that a smart-home purchase will pay for itself.
Open official model documentation ? Open official model documentation ?