Include standby time in a smart-light energy estimate
Calculate a labelled daily scenario for operating and standby electricity without claiming that automation guarantees savings.
Updated:
Count the hours when the lamp is not shining
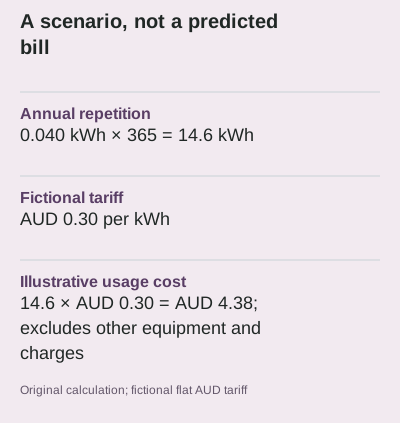
A connected bulb's energy scenario can include both illuminated operation and powered standby. Do not treat app-off hours as automatically consuming nothing. Philips Hue's Australian White A60 E27 example lists 9.5 W power and 0.1 W standby consumption. The Australian Government's smart-home guidance also says automation equipment adds to the household standby load. These are reasons to include the second term in a calculation, not proof of the power used by an individual installation. An unplugged or otherwise unpowered device is a different condition and may no longer provide the expected controls.
Hue AU White A60 E27 1100 model 8720169395268 ? Australian Government smart-home energy guidance ?
Write the assumed day before multiplying
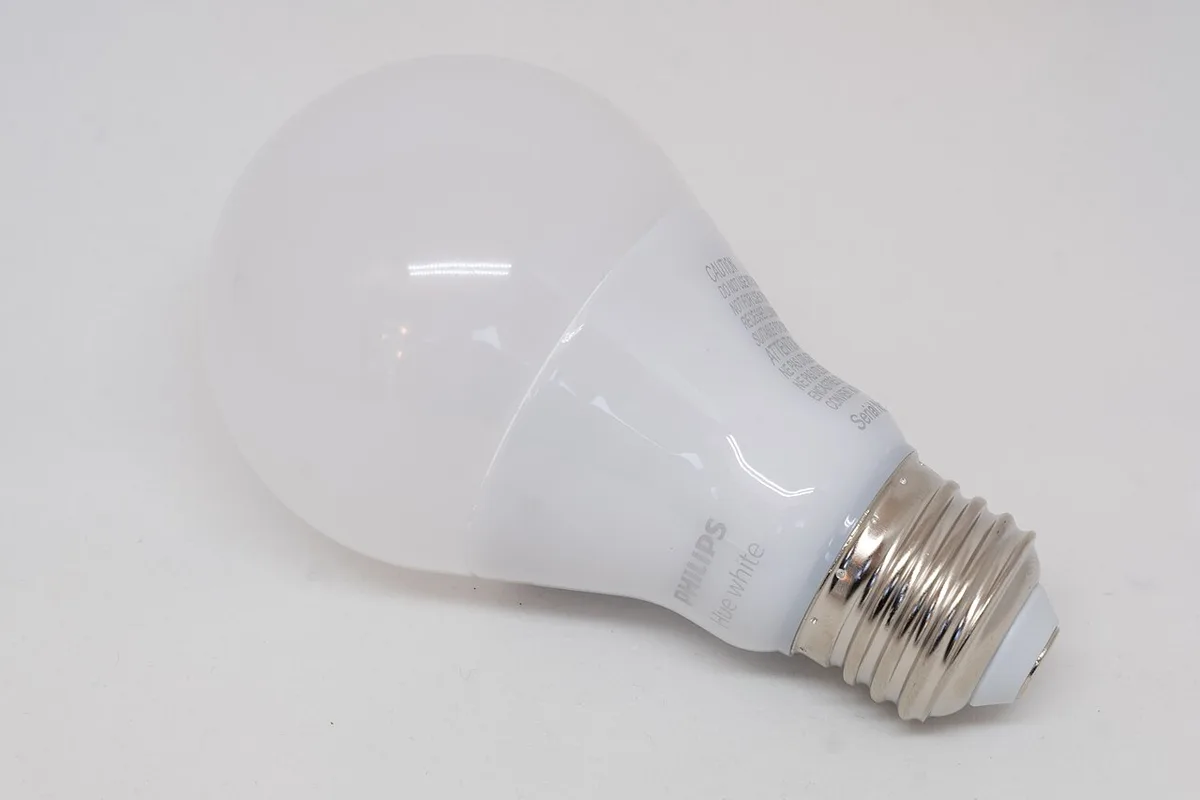
For an illustrative day, suppose the bulb operates at the listed 9.5 W for 4 hours and remains in the listed 0.1 W standby condition for 20 hours. The two periods add to 24 hours, which prevents double counting. Operating energy is 9.5 × 4 = 38 Wh. Standby energy is 0.1 × 20 = 2 Wh. The total is 40 Wh, or 0.040 kWh. These hours and constant power states are explicit assumptions. Actual brightness settings, product behaviour and household use can produce a different result.
Separate a yearly scenario from a bill prediction
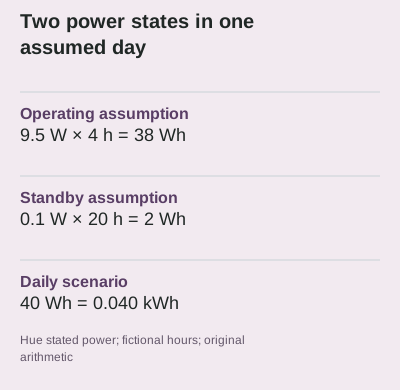
Repeating that identical assumed day for 365 days gives 0.040 × 365 = 14.6 kWh. At an illustrative flat tariff of AUD 0.30 per kWh, the corresponding usage charge is AUD 4.38. The tariff is invented solely for this worked example and is not an Australian market quotation. This calculation excludes supply charges and does not model time-of-use periods. It also assumes the same operating pattern every day, which is rarely a complete household description. The useful output is a transparent scenario that can be changed, not a forecast presented to the cent as certain.
Add the equipment that the bulb figure leaves out
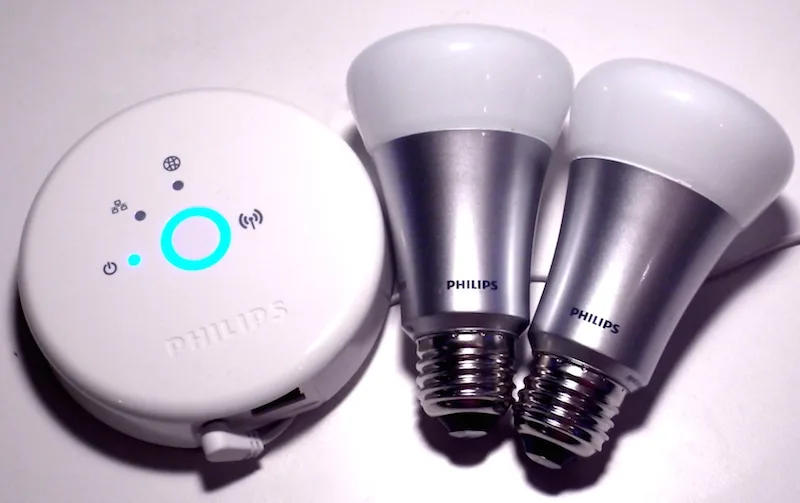
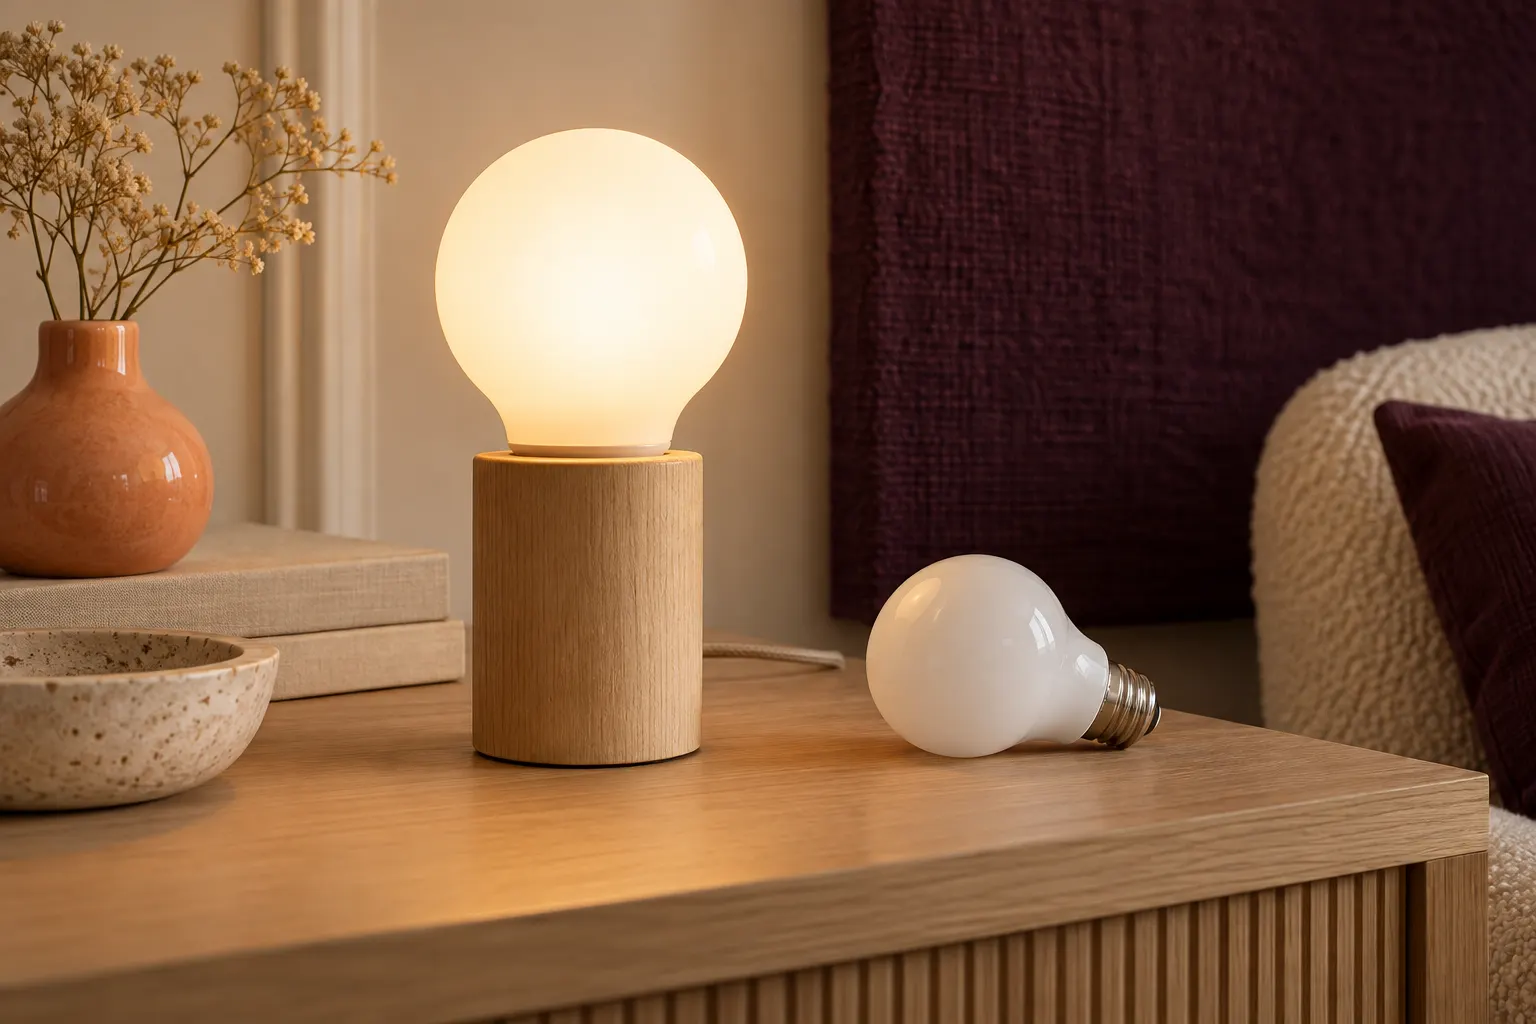
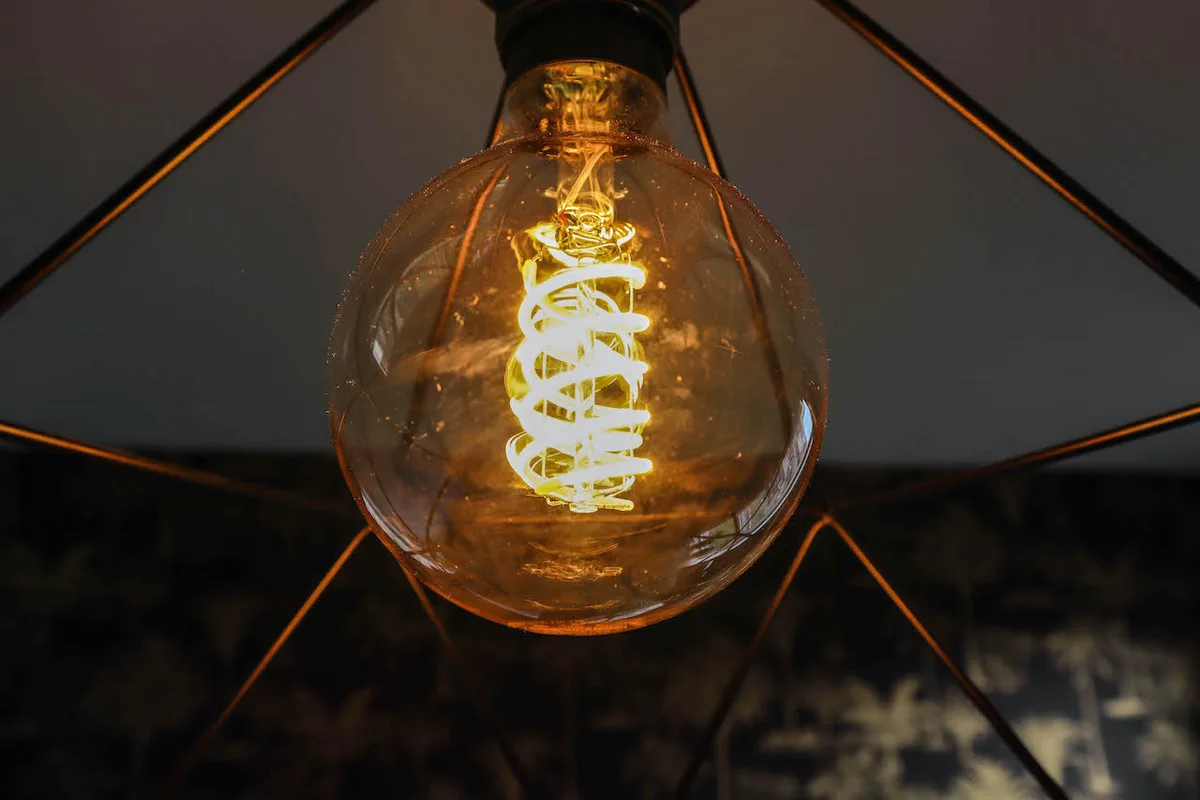
The bulb calculation does not include a separate bridge, router or other always-powered equipment. The archival kit photograph shows why the system boundary matters: the bulbs and the hub are distinct objects with distinct specifications. Do not use the pictured old bridge's appearance to infer a current device's consumption. Similarly, a photographed filament globe is not evidence that it shares the white model's power figures. A system estimate should list every included device and explain whether existing network equipment is being counted, rather than quietly including it in one comparison and excluding it in another.
Use observed records when they become available
Keep the assumed hours, documented power states, tariff source and calculation date in your planning file. If appropriate measurements or reliable equipment records become available, replace the relevant assumptions and preserve the distinction between measured and published values. Never subtract this scenario from a guessed old bill and call the difference a guaranteed saving. Automation may change behaviour as well as standby demand, and the comparison needs the same service and time period on both sides. The result should help you ask a more precise question about the proposed lighting setup, not promise that buying it pays for itself.
Open official model documentation ? Open official model documentation ?